Chrome:
1. Open Google Chrome and go to the page where the issue is occurring. (Note: When the Developers tool is opened it will be opened for the TAB that is currently selected)
2. From the Chrome menu bar select More Tools > Developer Tools (Note: you can also press F12)
3. From the panel opened, select the Network tab.
4. Look for a round Record button in the upper left corner of the tab, and make sure it is red. If it is grey, click it once to start recording.

5. Check the box Preserve log.

6. Click the Clear button to clear out any existing logs from the Network tab.

7. Refresh the page to ensure all necessary communication is captured.
8. While recording, reproduce the issue you are seeing.
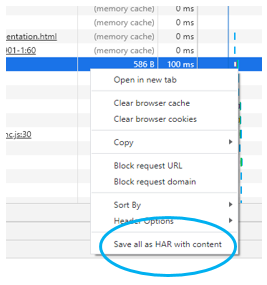
9. Once you have reproduced the issue and you believe it was recorded properly right click anywhere in the columns and select “Save all as HAR with content”
10. Once Saved provide to Vbrick Support for analysis
Firefox:
1. Open Firefox and go to the page where you are experiencing trouble.
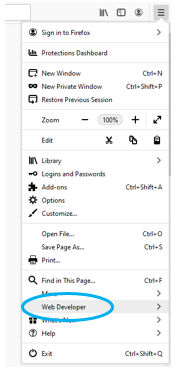
2. Select the Firefox menu (three horizontal parallel lines) at the top-right of your browser window, then select Web Developer > Network. (Note: you can also press F12)
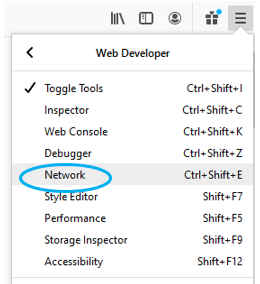
3. The Developer Network Tools opens as a docked panel at the side or bottom of Firefox. Click the Network tab.

4. Press the Clear button to clear out any existing logs from the Network Tab

5. Refresh the page to ensure all necessary communication is captured.
6. Reproduce the issue you are seeing step by step, until you believe the error has been captured successfully.
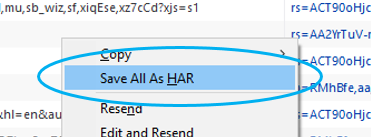
7. Once you have reproduced the issue and you see that all of the actions have been generated in the Developer Network Panel (should just take a few seconds), right-click anywhere under the File column and click on “Save all as HAR”.
8. Provide the file to Vbrick Support for analysis
Safari:
First verify if you have the Develop menu option enabled for the menu bar. If not follow the steps below to enable it:
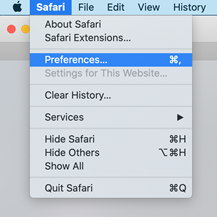
1. Open Safari -à Preferences
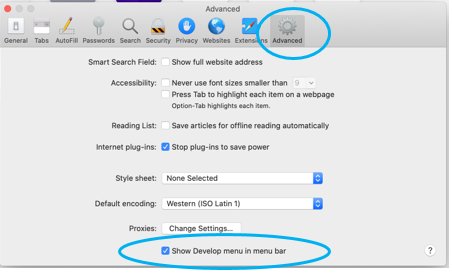
2. When in the Preferences Menu click “Advanced”. Under the Advanced tab enable “Show Develop Menu in Menu Bar”
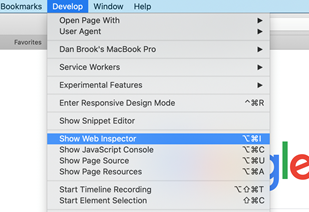
3. Now you will be able to open the Web Inspector.
To open the Web Inspector, follow the steps below:
1. Open the “Develop” menu and select “Show Web Inspector”.
2. Refresh the page to ensure all necessary communication is captured.
3. Click the Network tab and recreate the issue you are seeing in the active browser tab.
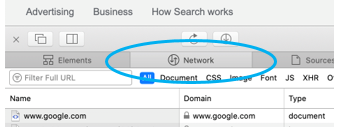
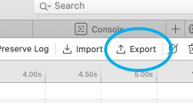
4. Click “Export” located on the far right of the network tab and save the HAR file.
5. Send the file to Vbrick support for analysis
Edge:
1. Open a new Edge browser tab
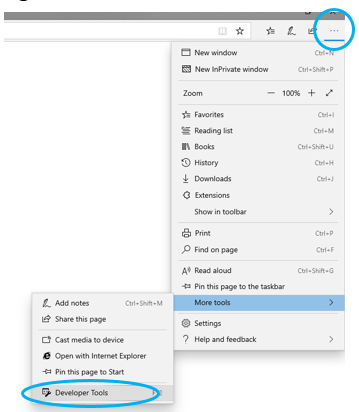
2. In the upper right had corner of the browser click on the three dots à Select “More Tools” à “Developer Tools” or you can press F12 on your keyboard.
3. From the panel opened, select the Network tab.

4. Select the green arrow to “Start Profiling Session” and track network activity

5. It will then change to the red square to show that it is currently recording

6. Click the Clear button to clear out any existing logs from the Network tab.

7. Refresh the page to ensure all necessary communication is captured.
8. Reproduce the issue that you were experiencing before, while the network requests are being recorded.
9. Once you have reproduced the issue click the disk to save as a Har file.

Note: in the newer versions of edge you are able to right-click anywhere on the grid of network requests and select “Save as HAR with Content”.
10. Send the file to Vbrick support for analysis
Internet Explorer:
1. Open Internet Explorer
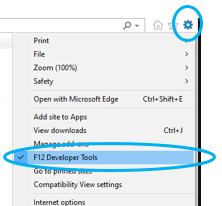
2. Click on the gear in the upper right hand corner and select “F12 Developer tools” (Or Press F12 on your keyboard)
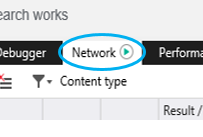
3. Click the Network tab.
4. Refresh the page to ensure all necessary communication is captured.
5. Navigate to the page with the issue, and reproduce the behavior that you were experiencing and wish to be reviewed while the network requests are being recorded.

6. Once done click the Save button.

7. When saving make sure it saves in the .har filetype
8. Send the file to Vbrick support for analysis

